

Nothing worth having comes easily, and it takes time to see results.
It’s easy to forget those two things when you’re looking into campaign performance online.
Measuring traffic is the go-to solution for new marketers, but measuring the pipeline is the true game-changer.
Everything has lag
Seeds won’t grow overnight, dominoes take time to fall in line, and people need time to make decisions.
Everything in our Universe experiences lag (even light!), so let’s not measure any instantaneous metrics; let’s calculate the expected outcome after the lag has occurred.
Measuring the lag window
Every industry will have a different lag window; for example, people might make snappy decisions on ordering a takeaway online but might take weeks or months to research and buy the ideal Smartphone package.
You can measure lag by exporting your CRM data to show the difference between when a user first makes contact and when they make a purchase on average:
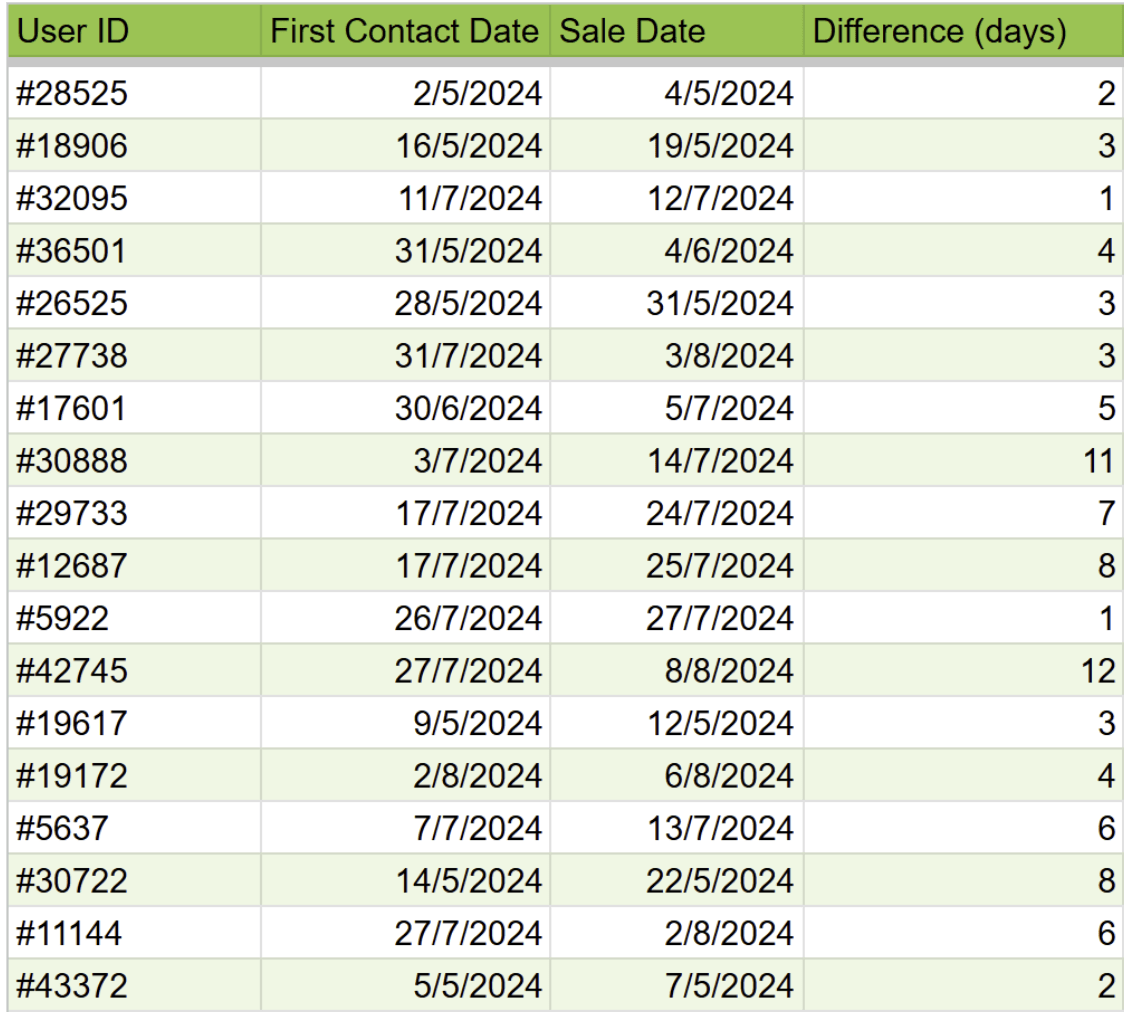
Plotting a histogram on the ‘Difference’ column will reveal the lag pattern:
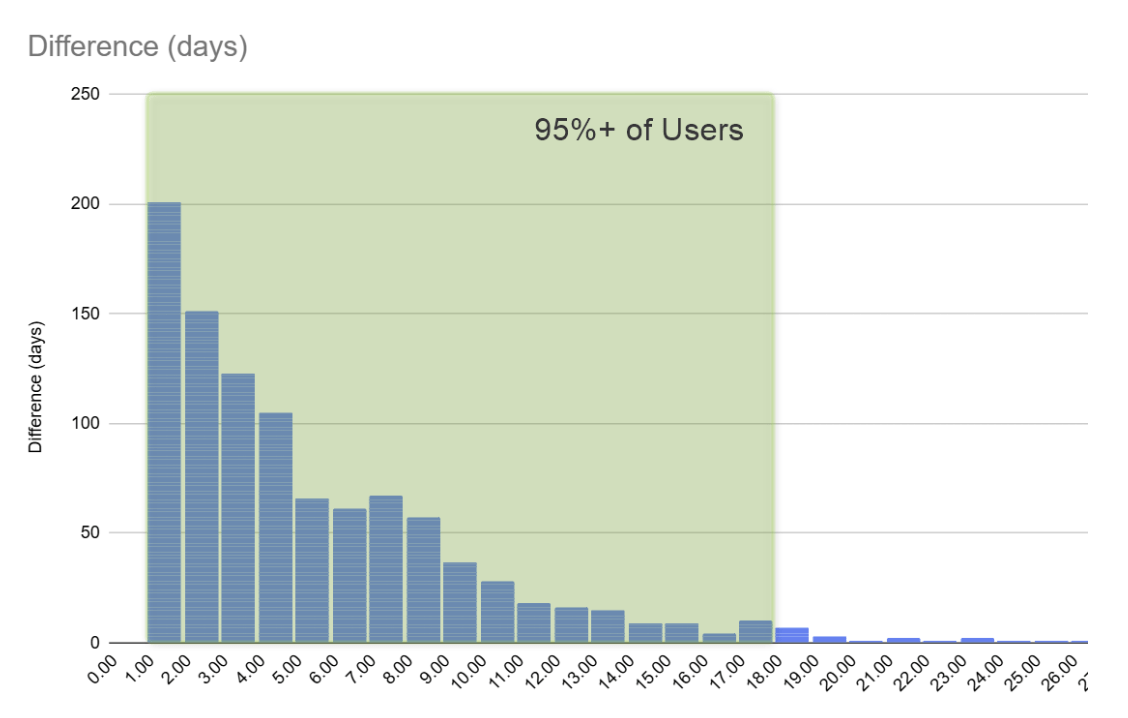
The exact lag pattern isn’t that important; we just need to get an idea of the average lag time for 95%+ of users.
In the example above, the lag window is roughly 18-20 days, and we can determine that:
- 20.2% of people take 1 day to make a sale
- 15.1% of people take 2 days to make a sale
- 12.4% of people take 3 days to make a sale etc.
Most lag patterns will have a half-life decay, so they can be boiled down to a logarithmic formula if high precision is needed.
Tracking the pipeline conversion rate
It’s possible to track a pipeline when you have enough historical data, i.e:
- Enough volume of data to make clear judgments on performance
- A big enough time window of data to eliminate lag
We’ll need to measure the percentage of users who start their journey on a website, and the percentage of them who hit key metrics along the way:
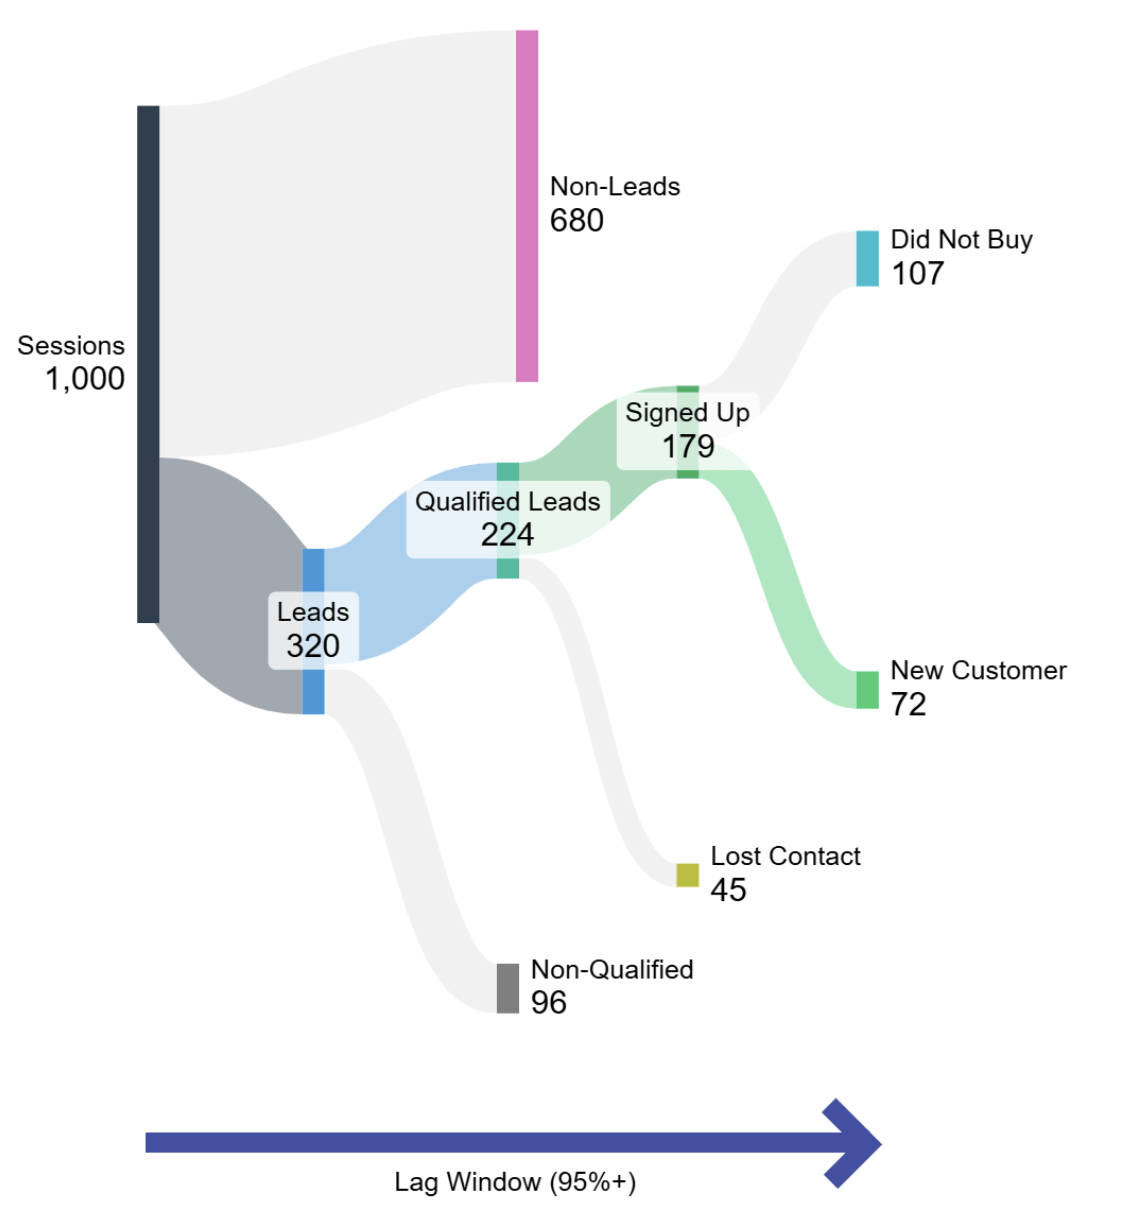
We can see that per 1,000 sessions, we get 72 customers on average, giving us a new customer probability of 7.2% per session. (Note that it’s important to eliminate the lag window in these results from recent sessions that have yet to mature fully).
If the lag window was three months long, for example, then we shouldn’t base any data on the past three months of conversion data, as time is still needed for those leads to mature.
Visualising the pipeline data
We now have a tool where we can measure predicted future success from current traffic levels.
Coupled with subsequent sales with extended lifetime customer value, it’s possible to make an educated guess on the overall return from current traffic levels.
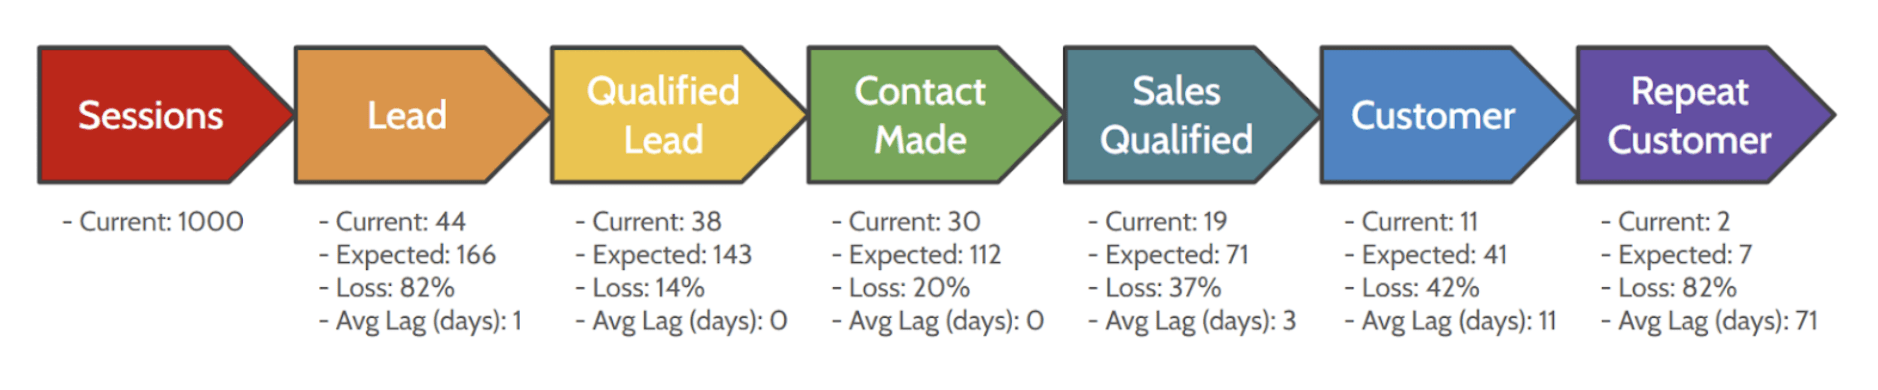
If you fancy a challenging data task, then the pipeline data can be broken down into steps, and each step’s probability, lag window and real-time results can be fed into the same report:
It’s important to segment these reports into different campaign types and media, especially if you have branded campaigns vs. non-branded campaigns, which will exhibit different user intents.
Calculating expected pipeline ROI
Many campaigns will originate from paid ad platforms, allowing for a return-on-investment (ROI) calculation to be made.
Using pipeline data allows paid advertisers to invest now for future gains, sometimes making a clear loss in the short-term, but for an expected profit after post-lag period and when factoring in return customer value.
They can calculate this by first calculating the average cost per customer based on the pipeline session to customer percentage, and the cost per session on average.
The next step is to calculate the lifetime customer value, which is a combination of the initial sale amount and the expected future sale amounts from each customer (via repeated sales).
Expected ROI = (Customer Lifetime Value (CLV) – Avg. Cost Per New Customer) / Avg. Cost Per New Customer
It’s important to break paid campaigns down into segments that will have different pipeline results, such as:
- Branded vs. non-branded
- Top, middle or bottom-of-the-funnel
- Search, display or social
This is how many larger companies operate, especially in B2B sectors, where the lag time before initial contact and a sale could be up to 12 months.
Filling in missing pipeline data
In an ideal marketing world, every business would have years’ worth of high-quality customer data, but sadly, this isn’t the case for newer businesses or companies without organised CRM data.
A lot of effort may need to be undertaken to draw as much information as possible out of 1st party data, or by benchmarking performance from others in the same industry.
Long-term values can be ‘eyeballed’ by adding data to charts, where trends can become quite clear.
For example, we could plot the amount of revenue generated from each user on a website, since they initially visited the website:
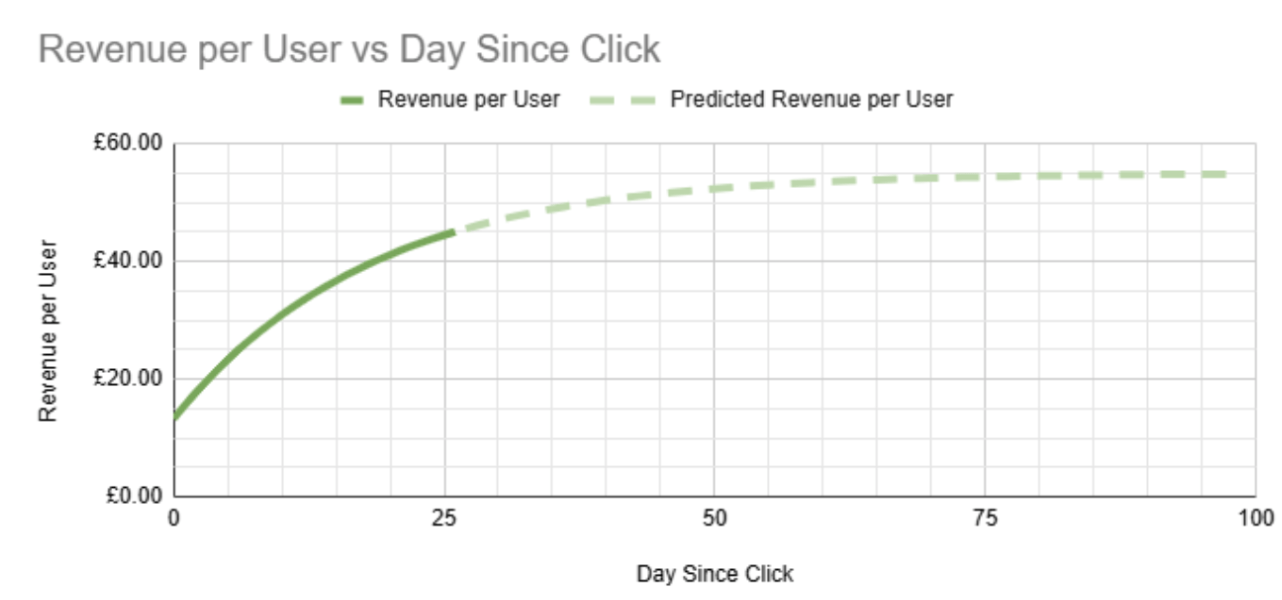
Even though we have just 26 days of data here, we could predict that overall, the revenue per user after 100 days will be around the £55 mark if we continue the curve’s trajectory.
You can see this type of report in GA4 if you have purchase events set up correctly under: Life Cycle > Retention
Conclusion
Visualising pipeline data allows you to predict the future, and more importantly, it allows you to invest now for future gains.
Most paid advertising platforms work on a bidding system, where the highest bidder gets the most prominent ad slot. If the pipeline data shows that you can invest heavily now for future gains, then this can push ads into higher ad positions, increase traffic levels and therefore increase sales volumes, beating the competition.
Are you looking to measure pipeline, not traffic? Get in touch today.