
Having a thorough understanding of how attribution models can be used to assess the value of a marketing channel will improve the way you measure the success of your digital marketing efforts.
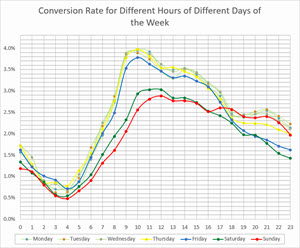
Users take a number of paths en route to converting, often it’s not as simple as clicking an ad and converting in a single visit. Take a look at these typical paths to conversion, for example, which indicate multiple website visits before conversion:
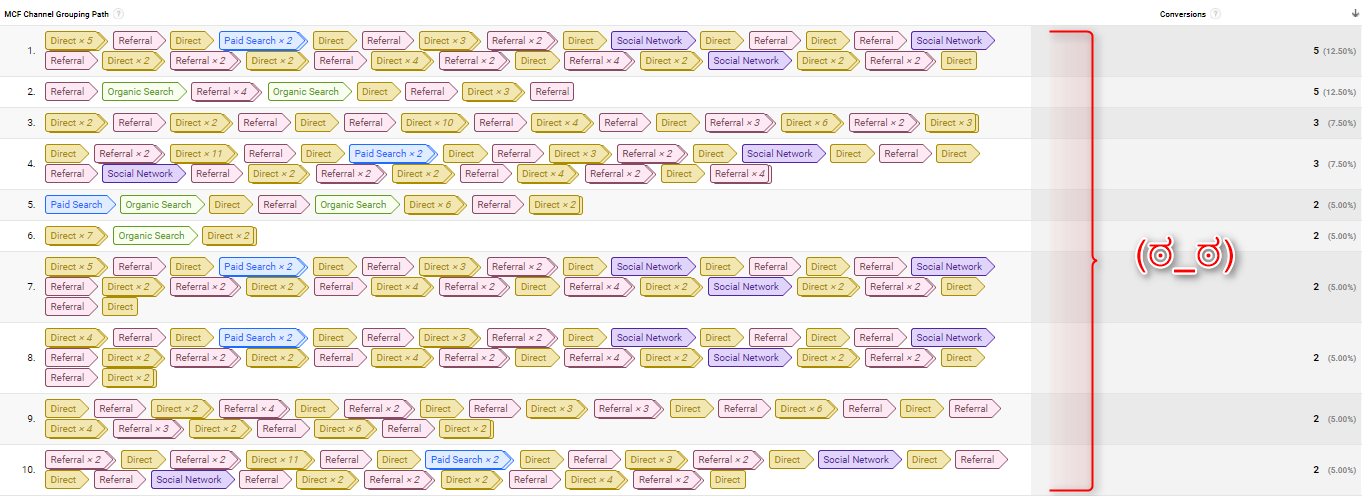
Looking at the typical conversion path of an industry with a much longer decision-making process is an even bigger challenge for marketers trying to assess the value of a specific marketing channel!
When we track performance in Google Analytics we need to know where each channel fits into the conversion path, allowing us to better optimise and leverage our marketing budgets,
In this article we explain the different attribution models available in Google Analytics and how these can be used to analyse the success of each marketing channel you have at your disposal.
What is marketing attribution?
“Marketing attribution provides a level of understanding of what combination of events in what particular order influence individuals to engage in a desired behavior, typically referred to as a conversion.”
Source: Wikipedia
Applying this to digital marketing, the concept of attribution will help you identify the value of the different paths each user took before landing on your website and eventually converting. A conversion could be classed a sale, or it could be a visitor giving you their contact details through a form. But if this conversion eventually happened after a visitor landed on your website on three separate occasions through three different channels, are you attributing the appropriate percentage of that conversion to each channel? If the answer is “No” or “I’m not sure”, keep reading.
The problem with ‘last-interaction’ attribution
Last interaction (or last non-direct click) attribution is the default model within Google Analytics and apportions the entire value of a conversion to the last channel that a visitor used to reach your website before converting. This can be useful if you have a short sales funnel with no consideration period but for the majority of marketers this won’t tell the full picture.
This method of attribution assigns no value to any of the channels that previously drove customers to a website and clearly doesn’t enable marketers to show the full value of their efforts across multiple channels.
If we look at a real-life example of this, imagine 4 people took different modes of transport to work in the morning. One employee may take the bus, another get the train, one may bike in and the other walk to the office. Upon arrival, they each have to take the lift up to the office door. In this theoretical ‘last-interaction’ scenario the lift would be given full attribution for those people arriving at the office!

This example highlights how last interaction attribution masks the true value of each marketing channel and why multi-channel attribution modelling is so important in the current environment.
Attribution models in Google Analytics
Let’s take a look at the standard out-of-the-box attribution models that Google Analytics has to offer.
 Last Interaction
This model attributes 100% of the conversion value to the last channel the visitor interacted with. It could be useful if your ads and campaigns are designed to attract visitors at the point of conversion, or if you have a short sales funnel with no consideration period.
 Last Non-Direct Click*
This model attributes 100% of the conversion value to the last channel clicked through from, ignoring direct sessions (traffic). It could be used if you consider customers from direct sessions to have already been ‘won’ by another channel.
* This is the standard model used in all non-multi-channel reports you see in Google Analytics.
Last Google Ads Click
This model attributes 100% of the conversion value to the most recent Google ad that was clicked prior to conversion. It is intended for us if you want to find out which of your ads close the most conversions.
 First Interaction
This model attributes 100% of the conversion value to the first channel the customer interacted with. It could be used if you are aiming to raise awareness with your campaigns and ads, and place more value in first interactions.
 Linear
This model gives equal attribution to each interaction on the path to conversion. It could be useful if your aim is to maintain contact and awareness through every stage of the buying cycle (but still use with caution!).
If are after a level playing field, this model will do the trick. For example, this will allow you to see where your PPC ads play a role in every single conversion path, alongside a % of what is has attributed.
 Time Decay
This model gives more credit to the touchpoints closest to the conversion in terms of time, and less to those further away. This model is useful if you value those actions that are closer to the conversion, or if you have a shorter buying cycle.
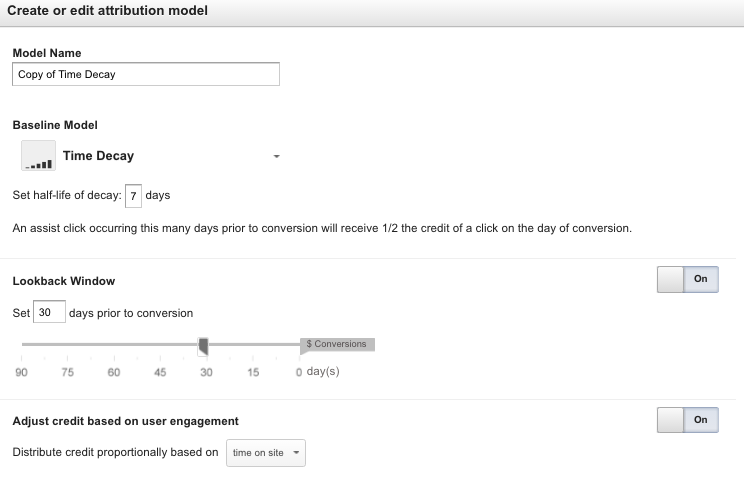
Time decay is more useful as a standard option, but if you have a particularly long buying cycle, or are worried about channels such as social getting very little attribution, then it could cause trouble.
However, you are able to tweak this base model, and adjust the half-life of decay, lookback window and tweak credit based on engagement metrics:
 Position Based
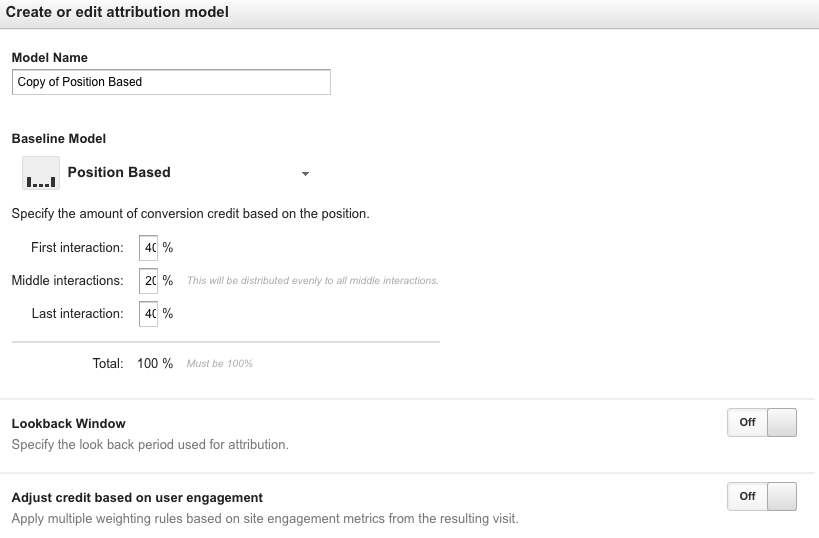
This model allows you to split the attribution by varying amounts. By default, GA will assign 40% to the first and last interaction and 20% to interactions in the middle. This model is useful if you most value the first and last interactions, but still want to give attribution to the touchpoints in-between.
Again, you can create a custom copy of the Position Based model, but it requires some dedicated thought, research and ongoing testing to get this right:
You should seek to build and test a custom attribution model based on data and your specific business needs. For example, by taking into consideration the type of behaviour you value the most, historical data about your sales funnel and conversion window, as well as trying to gain an understanding of the lifetime value of a customer to your business – more on that here.
If you are going to start testing custom models, a good place to start would be to tweak the Time Decay and Position Based models and comparing the data with the default attribution reporting within GA.
Multi-channel funnel reports in Google Analytics
Google Analytics Multi-Channel Funnels is the place to identify your top conversion paths, typical path lengths, and report on assisted conversions by channel.
There are a number of features within the multi-channel funnels section of GA that can be used to test different attribution models and assess which may be most relevant if you’re trying to justify a particular type of marketing activity.
The Conversions > Multi-channel funnels > Overview section shows you a visual of where your channels overlap.
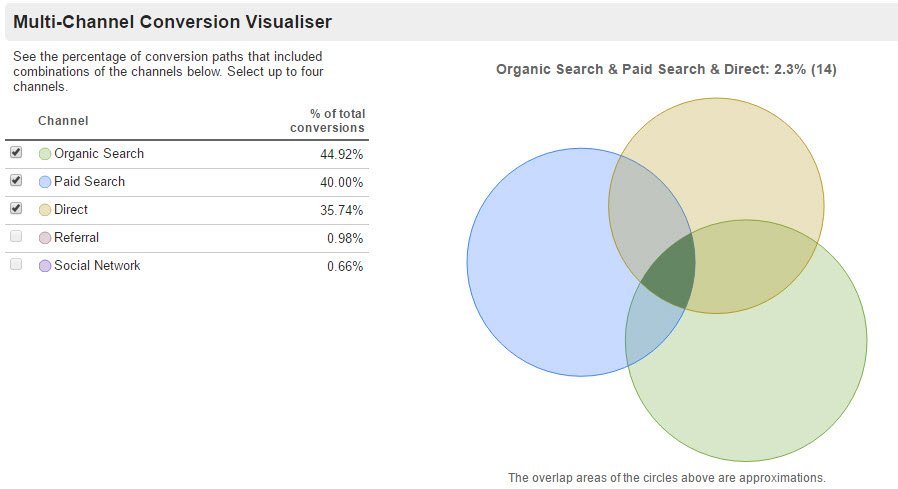
The overlap percentage shows where the path to conversion contains two or more channels. So this gives a simple overview of which percentage of traffic requires a deeper look at attribution modelling to help better demonstrate its value.
Analysing top conversion paths
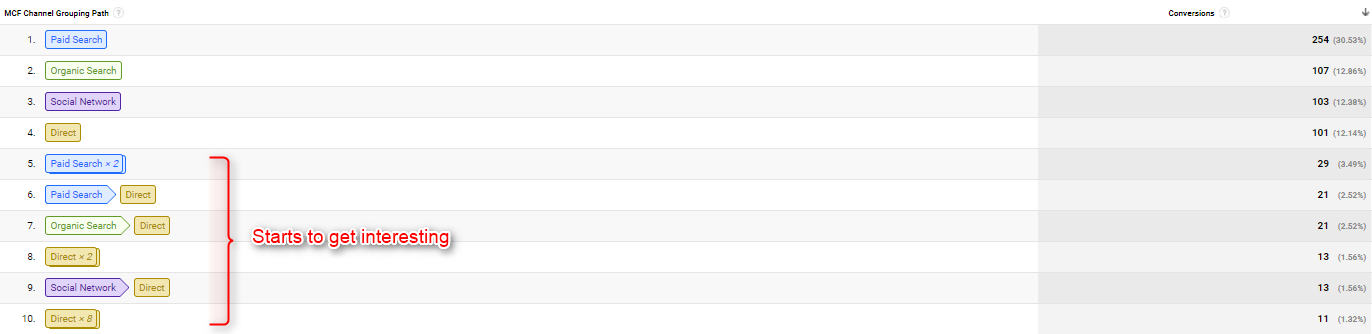
Within the top conversion paths report in the MCF section of Google Analytics you will be able to view an ordered list of the top referral paths and how many times users interact with each channel before converting on your site.
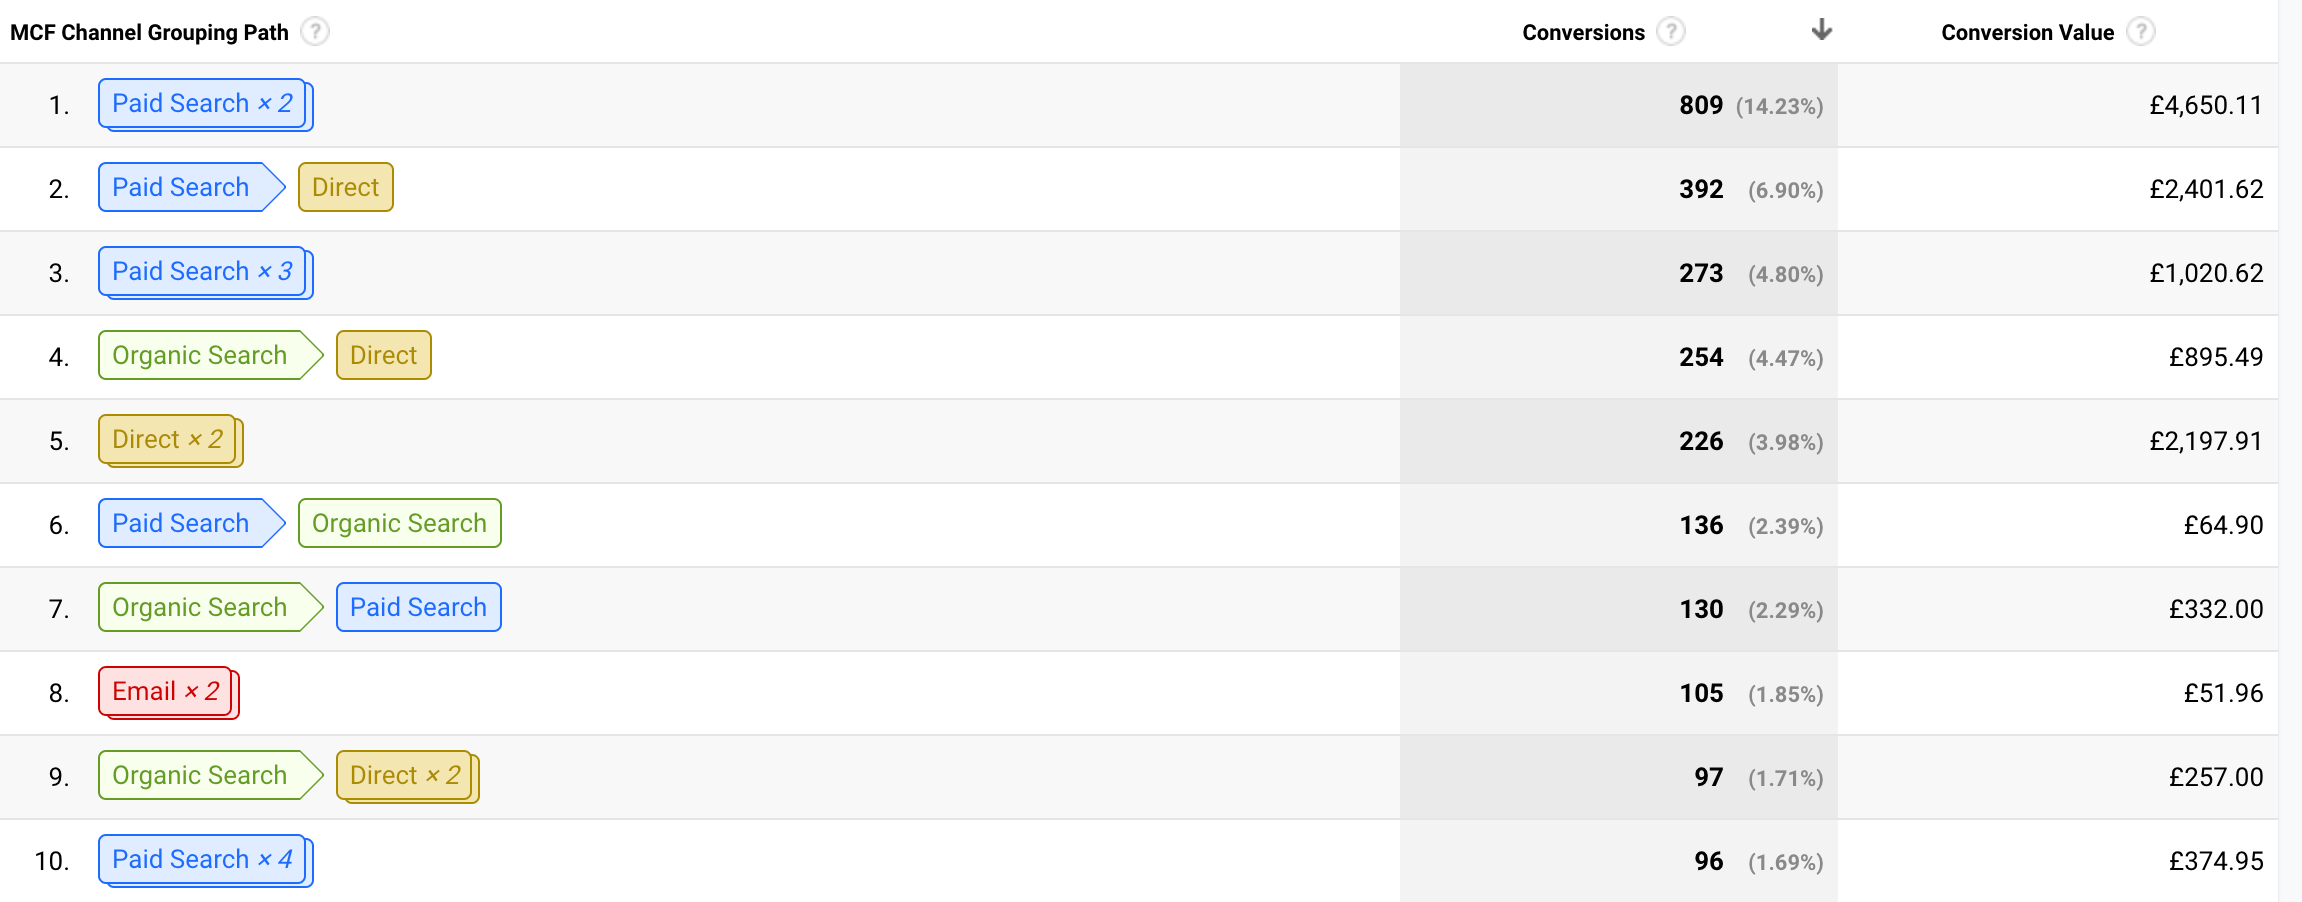
If this data showed that organic search typically played an assist role rather than a last interaction role, this may mask the real value of SEO activity and indicate the need to review alternative attribution models such as position-based or time decay as detailed above.
Reviewing conversion path length
The Conversion Path Length report shows how many conversions resulted from conversion paths that contained 1, 2, 3, 4, 5, 6, 7, 8, 9, 10, 11, or 12+ referrals before converting, and orders the conversion paths based on the most common number of visits before conversion.
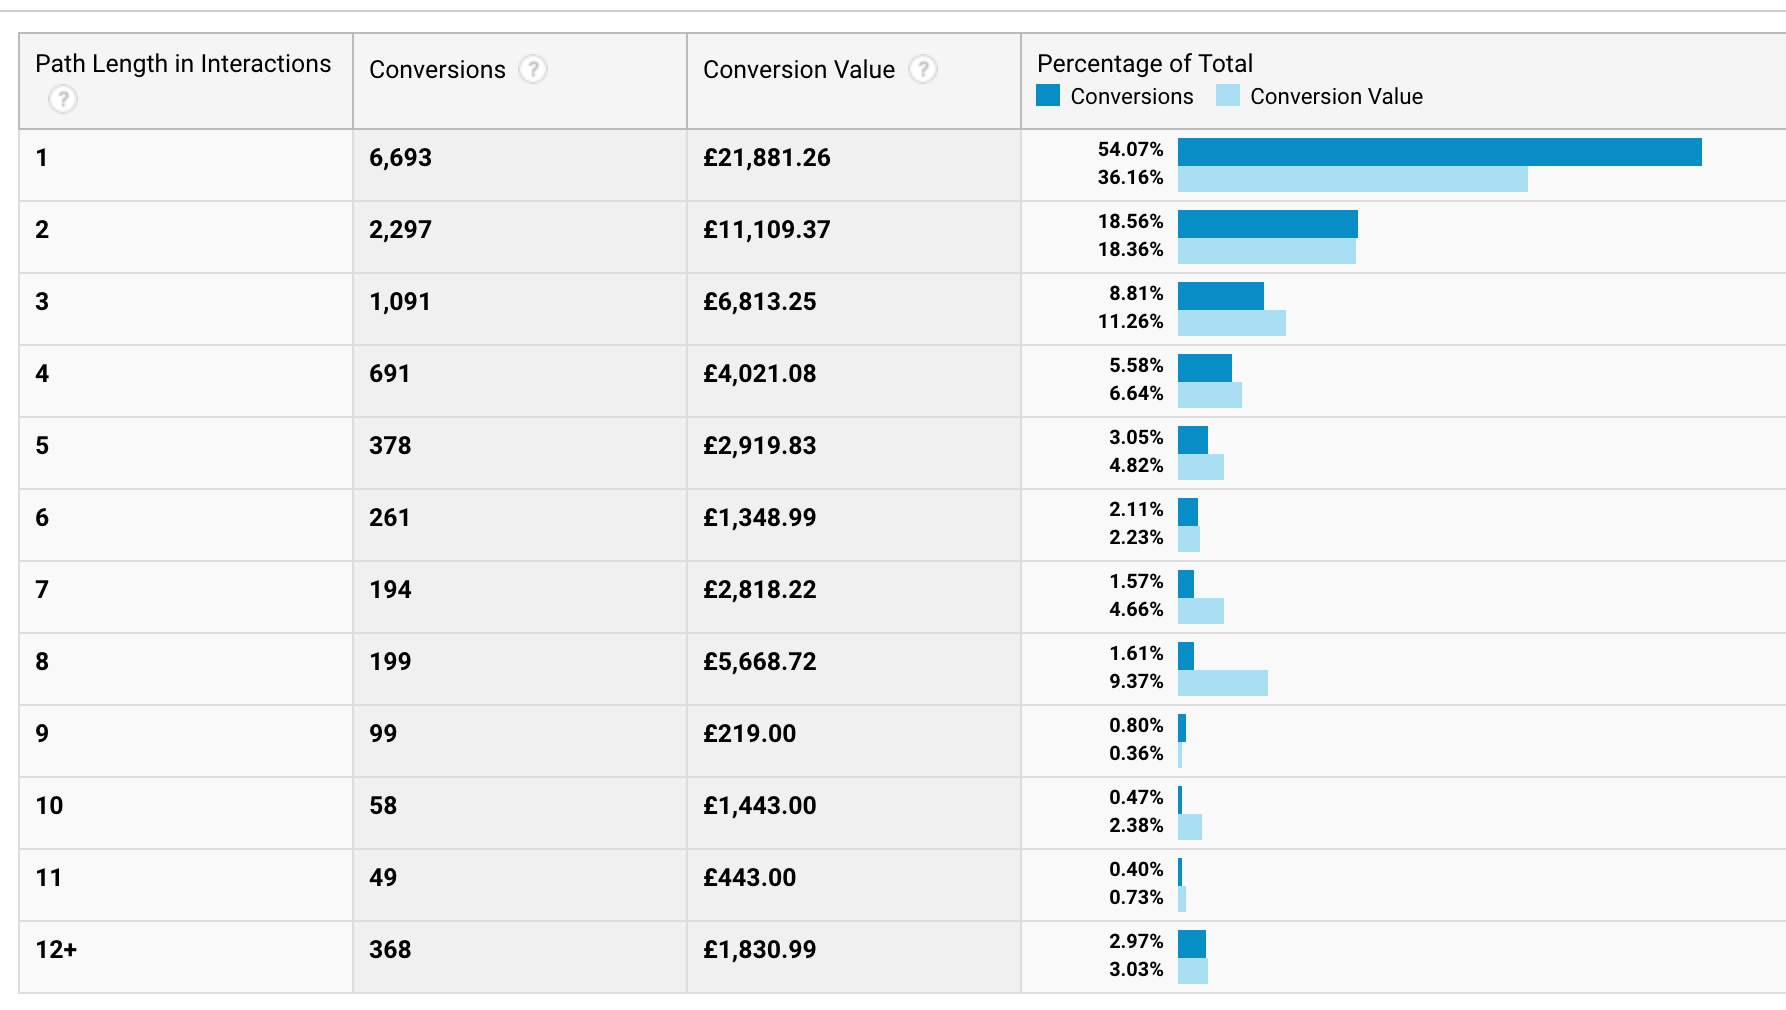
This data can be extremely useful for PPC advertisers. For example, this data can be used to build remarketing lists to boost PPC performance. In an example where most conversions occurred on the 2nd visit, a remarketing list could be used to increase bids for users who have visited the site only once previously but not yet made a purchase.
Comparing attribution models
To compare the attribution models we’ve listed in this article and how they impact the reported performance of each channel, navigate to conversions > attribution > model comparison tool.
This tool will allow you to select and compare different models. In the example below, Last Non-Direct Click is being compared with Time Decay. You can see that using Last Non-Direct Click, attribution for the direct channel has been distributed to other channels, compared to Time Decay where the direct channel has an increase of 75% by comparison.
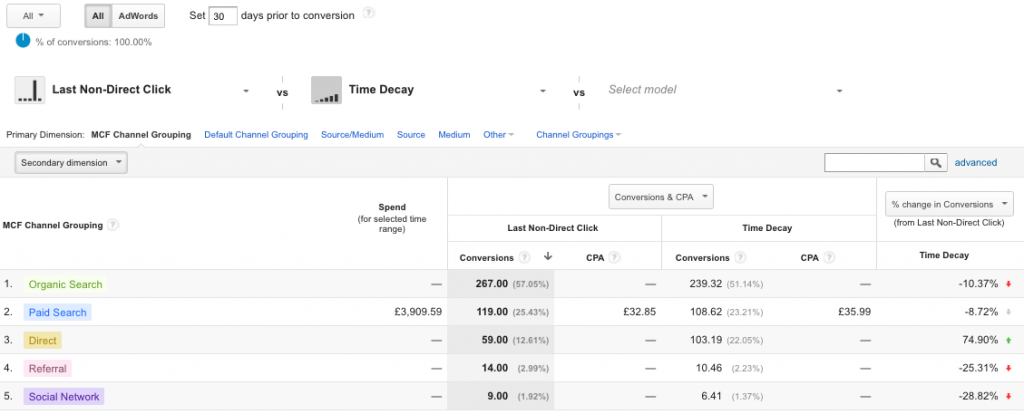
This is a hugely valuable tool for assessing multi-channel attribution in just a few clicks. The only hitch is that the information provided is only as good as the model you use and shouldn’t be tweaked per channel to over-inflate the importance of each channel depending on their individual roles in a conversion path – the model should be defined overall based on what’s right based on your business taking into account your typical conversion funnel.
Basic steps to improving attribution
Aside from the techniques highlighted in this article, there are some simple things we often encounter when reviewing Google Analytics setups for new clients that can very easily be resolved to better track digital performance.
- ensure you have successfully set up conversion tracking, including micro and macro conversions.
- if you’re a non-ecommerce company, do some analysis to figure out your conversion values in economic terms where possible, and add these values to Google Analytics as goal values
- make sure you track all of your campaigns using parameters. This one is very important if you want multi-channel attribution to work.
Conclusion
For most, your biggest marketing aims will be to turn your website visitors into customers, keep your cost per lead/sale at a level that makes business sense and to retain your customers for longer in order to get a higher lifetime value.
In order to get powerful data to report on your digital marketing success and ROI in a multi-channel world, you need to become familiar with attribution modelling.
If you are using Google Analytics, I would recommend testing either the Position Based or Time Decay models to begin with and then start to customise your attribution approach within your marketing reports.