Picture a pilot coming in to land and the plane is suddenly swayed left by a gust of wind. To compensate, the pilot quickly swerves right but overcompensates, prompting them to take another quick jerk to the left, repeating that same vicious cycle until the plane eventually flips and crashes on the runway.
Apply this analogy to any of your marketing campaigns: reacting suddenly to changes in data can hinder your campaigns’ chances of success.
There are many factors that can affect how quickly you should respond to changes and, most of the time, it’s important not to panic.How frequently should you check your analytics?
If you’re glued to a live lead-checking tool, you could be in danger of crashing and burning any related marketing campaign.
There’s nothing wrong with checking key statistics regularly, but reacting to changes immediately can easily start to spiral out of control.
Reaction time frames
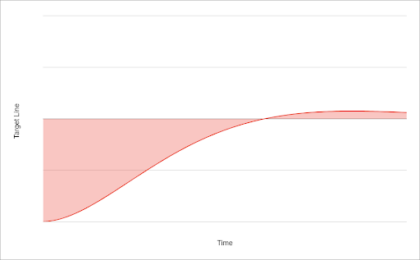
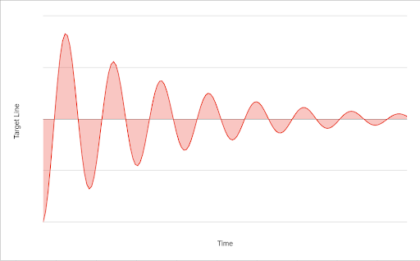
How quickly you react to changes will determine how quickly you can meet targets. For example, we all know that a very slow reaction time can lead to very slow results: But, constantly reacting quickly to minor changes can have the opposite effect, resulting in wild swings away from a target and a long settle time:
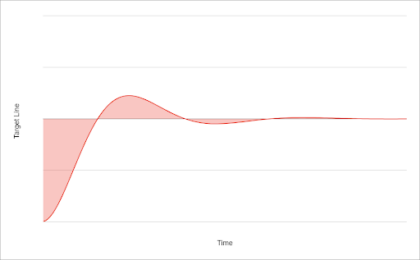
 The key is to take a balanced approach by only reacting upon changes once there’s enough data to back up your decision:
How quickly should you react to changes in performance?
How quickly you should react to changes depends on a few factors, such as:
- Data delay: it can take up to 48 hours for all data to be processed, and even longer to see the full results from any marketing campaign online. A general rule of thumb is to ignore the past two days worth of data due to being incomplete.
- Lookback windows: if you’re comparing data periods, then the lookback window is an important consideration. Looking back over the past five days for example, compared to the five days beforehand would include a weekend in one period and not in the other which can massively skew data. The same goes for month-on-month comparisons where the length of months are very different (Jan to Feb for example), it’s best to use weekly lookback periods of 7 days, 14 days, 28 days, etc.
- Seasonality: certain times of the year noticeably affect traffic levels and conversion rates online. National holidays especially change users’ behaviours online, particularly around New Year, Black Friday, and any major country-specific holidays such as Christmas. It’s best to either look at last year’s trends during these periods or do some research into how any seasonality changes affect your website’s niche and factor these changes into your analysis.
- Website changes: when big changes are made to a website, this can lead to broken pages, changes in user behaviour, and even missing data due to cookie banners or broken tracking. Try to avoid any big website changes in your analysis to avoid coming to any wrong conclusions.
- Campaign changes: if a huge campaign is turned on or off, then this often makes a big impact on analytics data. This can include paid media campaigns, email campaigns, or social media campaigns. It’s best to segment by campaign data to measure performance on individual segments before making any snap decisions.
Once you’ve taken all the above factors into consideration, you can make informed decisions, with accurate data, at the right time.
Remember that the time spent checking stats daily could be better spent improving your brand, website, or any active campaigns you have running!
The right platform can make all the difference
GA4 is a great way to keep track of your data and make better marketing decisions, and with the recent transition from Universal Analytics, it’s something many people are struggling to wrap their head around.
If you want training then our team can help you navigate the new platform and start making the most of its new features. You can enquire about training through our contact form.


